

Rocks And Stocks News Report On Power Charts From Companies In Eureka, Nevada
I'm a big fan of mining exploration in Nevada. Eureka, Nevada has a group of exciting companies focused on this camp.

Yesterday, I put out a special Christmas Day report on why I see a bullish market for gold and other metals shaping up. I also discussed i-80 Gold which is significantly outperforming its peers, and why it is still very undervalued and has many catalysts to unlock shareholder value.
You can find that report here.
i-80 Gold (IAU.T and IAUX.NYSE) has a very powerful chart, rightfully so as they have exceptional projects and have been making remarkable news throughout 2022. Today I wanted to present additional companies with power charts and some that I think are on the verge of turning into power charts.
To put things into context about how the mining explorers, mine developers and junior miners are performing, below is the chart of the GDXJ ETF which tracks the performance of a large group of them.

As you can see a big correction started in April, and by late September it had been cut almost in half. This was a very challenging period for the smaller mining related stocks. But, then it went through a triple bottom and in early November it broke out above the 50-day moving average and is now trading right on the 200-day moving average. The 50 DMA is in a bullish trend and heading toward crossing the 200 DMA to create a Golden Cross. I expect that to happen in January, 2023.
Gold is a very important metal to watch as it is a sentiment driver for the whole metals space. Where gold goes, so goes many metals and the mining stocks from small to big.

Gold topped in March and then went into a correction that had a triple bottom in September, October and November. Although it wasn’t nearly as severe as the GDXJ, it was still a serious correction. As is often the case, the mining stocks will drop more in percentage terms during corrections, and they will outperform during bullish trends.
Gold and the US dollar aren’t perfectly correlated but they are very close, and we can see trends in the USD that shines a bullish light on gold.
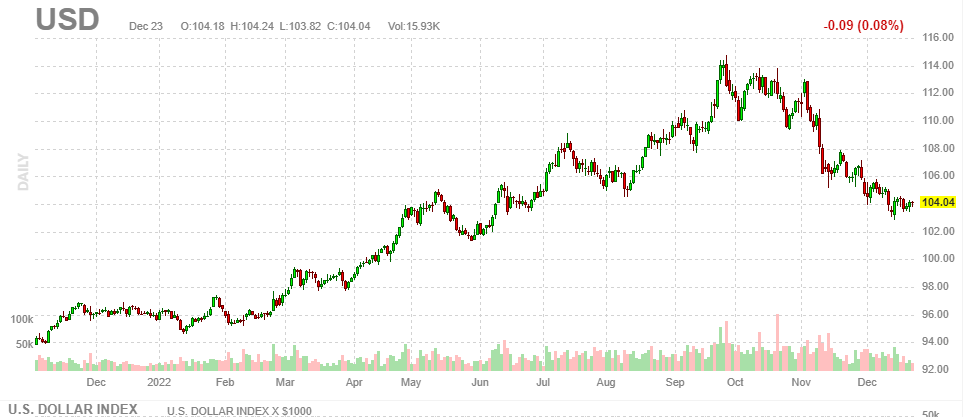
Chart courtesy of Finviz.com
As you can see in late March, when it became clear that the Federal Reserve would be raising interest rates, the USD index went on a powerful move. It is often said that correlation is not causation. In the case of gold and the USD it certainly shows that the weakness in gold from March to September was closely linked to the powerful move in the USD.
I would also point out that since early November the USD has been suffering a significant correction while gold is getting much stronger. No they aren’t perfectly correlated as contrary movers, they sure are close. When the USD is in a bull trend, gold and other metals are in correction, and when the USD is correcting, the precious and base metals do much better.
One can’t ignore the correlation as it is pretty logical that they would move in opposite directions as the most watched pricing of the metals is what it is doing in US dollar terms.
While all this was happening, have a look at the power chart that i-80 Gold (IAU.T and IAUX.NYSE) has gone through.

Much like the GDXJ, around one month prior to the GDXJ topped i-80 Gold topped in March then went into a correction that cut it almost in half. Interestingly, i-80 Gold bottomed before the GDXJ and had a more bullish bottoming trend. It went through a triple bottom, but two of those bottoms where at higher lows. Then in early November it blasted off and signicantly outperformed the GDXJ.
i-80 Gold broke out above its 50 DMA and 200 DMA in November, then went through a Golden Cross and is now trading well above the 50 and 200 DMAs. The main reason for this power move was an important news release.
On November 14, 2022, they put out a news release, this is the headline from that release: “i-80 Gold Hilltop Discovery Yields Bonanza-Grade CRD Mineralization at Ruby Hill.” The highlight drill hole from that news release reported results that included 60.2 g/t Gold, 908.7 g/t Silver, 15.7 % Lead and 1.1 % Zinc over 10.0 m.
There are several reasons I’m very bullish on i-80 Gold, you can find them in the report linked earlier in this report.
The next company I would like to highlight is Paycore Minerals (CORE.V). They have the ground right beside i-80 Gold’s Ruby Hill project. Also on November 14, 2022, they had impressive news out as well.
Here is the headline: Paycore Minerals Intersects 14.8 Metres Of 6.3% Zinc, 10.3% Lead, 376 G/T Silver And 7.1 G/T Gold, Including 5.8 Metres Of 9.4% Zinc, 3% Lead, 248.4 G/T Silver And 15.9 G/T Gold From The Poly-Metallic FAD Project.
Paycore Minerals has an imporant high-grade zinc-lead-silver CRD, with an overprint of high-grade gold. As I pointed out in the report yesterday, CRDs usually don’t have much in the way of gold. In the CRDs that i-80 Gold and Paycore Minerals they have a unique high-grade gold overprint.
Just to show how close i-80 Gold and Paycore Minerals are, this Google Earth image below shows it clearly. To the immediate south of the historically mined Archimedes pit, see yellow pin labelled i-80 CRD. Around 2000 metres to the south, you will see the yellow pin labelled Ruby Hill shaft which is near where Paycore Minerals has their CRD.

This Google Earth image also points out another important factor. To the immediate east is the town of Eureka, Nevada. This give both projects excellent access and will be important when considering building mines here. Not only are what they finding with their drilling exceptional, the location and access is enviable for many other mining projects.
Equally as important is that both these projects have the same kind of rock packages, so they share similar geology. From a geological perspective, another important thing to point out is you will see a series of darker features coming from i-80 Gold’s CRD over and through Paycore Mineral’s ground. These are the surface expressions of deep cracks or faults in the earth that allow the metal bearing fluids from much deeper to have a path of least resistance to make their way up to surface.
When checking off the boxes to find a CRD mine there are a few important factors. You need faults to be a conduit for the metals bearing fluids to make their way up from deeper in the earth, then they need to hit the right kind of rocks for them to create deposits, and ultimately you need the grades and widths of mineralization to become mines. i-80 Gold and Paycore Minerals are checking off all these boxes.
These aren’t the only similarities they have, below is the chart of Paycore Minerals that shows their stock following a similar path as i-80 Gold.
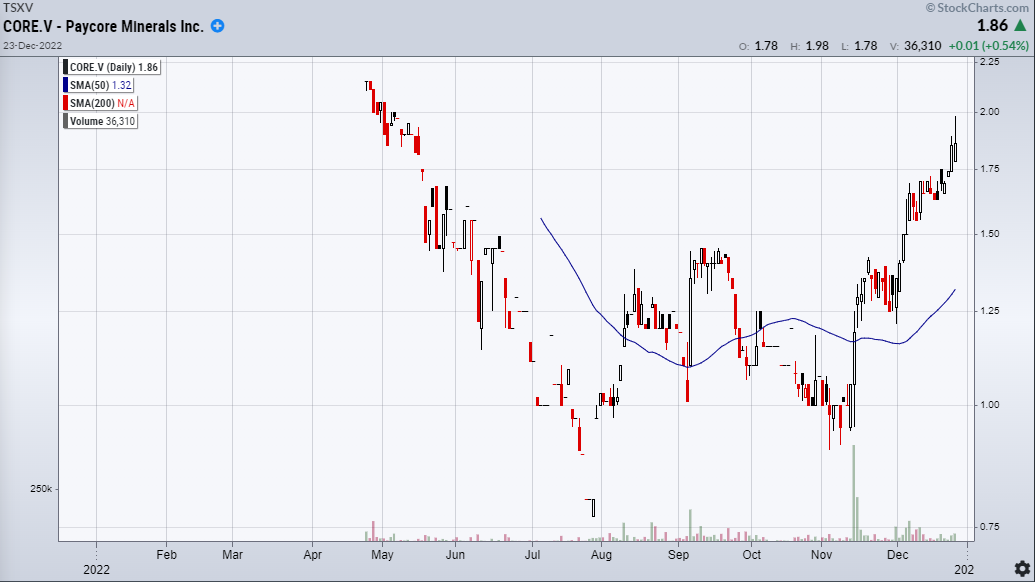
Paycore Minerals has only been a publically trading company since April, 2022. Where they really join up with the action in i-80 Gold’s big move was in November. They both broke out significantly in November. Now Paycore Minerals is trading aggresively above its 50 DMA.
Catalysts for Paycore Minerals include; when investors look at i-80 Gold they can’t miss Paycore Minerals, as gold goes higher it puts more wind in their sails, and additional news on drilling will also add fuel to their fire. I expect 2023 to be a big year for both i-80 Gold and Paycore Minerals.
Another company with important ground in the Eureka mining camp is Golden Lake Exploration (GLM.CSE). i-80 Gold, Paycore Minerals and Golden Lake Exploration are all sponsors of my reports, additionally I’m an advisor to Golden Lake Exploration.
There are key reasons why I became an advisor to Golden Lake Exploration not too long ago. One of those can be seen in the Google Earth image below.

By zooming out slightly on Google Earth you can see a yellow pin labelled Eureka Tunnel around 6500 metres from i-80 Gold’s CRD. The Eureka Tunnel was a location of historical mining decades ago.
Golden Lake Exploration has also drilled into an impressive CRD right beside the Eureka Tunnel. The highlight hole from their CRD included; 57.16 g/t gold, 453 g/t silver, 7.23% lead and 11.99% zinc over 3.23 metres.
Do you see the common theme? i-80 Gold, Paycore Minerals and Golden Lake Exploration all have high-grade zinc-lead-silver CRDs, with an overprint of high-grade gold.
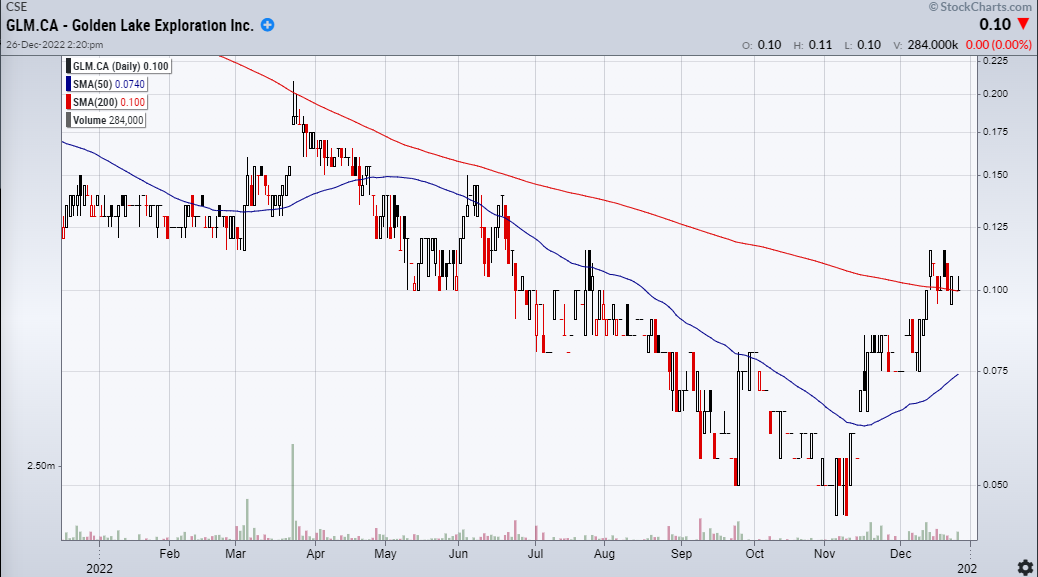
The Golden Lake Exploration chart shows additional similarities to the recent action in i-80 Gold and Paycore Minerals. It bottomed at a 52-week low in early November, then had a strong move well above the 50 DMA and is trading right on its 200 DMA. The 50 DMA is moving in a bullish direction and is heading toward a Golden Cross that I could see happening in early 2023.
Catalysts for Golden Lake Exploraton include; a stronger market for gold and gold stocks, more attention coming to the Eureka camp due to the success of i-80 Gold and Paycore Minerals, news about drilling to follow up on Golden Lake Exploration’s CRD.
Another exciting company I follow closely in the Eureka camp is Timberline Resources (TBR.V). They are right beside Golden Lake Exploration and they have a large land package in the Eureka Camp.

The key area for Timberline Resources is in the Google Earth image look for the yellow pin labelled Lookout Mountain Resource. They have a gold resource there and have been drilling to expand that resource. Assay results are pending for their recent drilling and I expect they should come out in January, 2023.
What makes the resource at Lookout Mountain exciting is that they are expanding it and hitting excellent grades as they move to the east. The key rocks and structures are going toward the east and lead to a massive geophysical anomaly. Everything is pointing in the direction of the geophysical anomaly as the source of where the gold resource came from.
Another thing that I believe a lot of investors following their drill results is overlooking, is not long ago they had news that indicates they may have clipped the edge of a CRD. Now, it didn’t have the same kind of grades as the three others I wrote about earlier. But, it is important to note that not far to the north of where they clipped a CRD is a key structural trend that is the likely suspect of where that CRD source is located.

Their chart is not as powerful as i-80 Gold, Paycore Minerals and Golden Lake Exploration. But, there are signs that things could be getting better for it soon. It had a double bottom in October and November, then had a breakout to trade up to its 200 DMA. It has come back down to its 50 DMA.
Catalysts for Timberline Resources include; stronger action for gold and gold stocks, more investor attention coming to the area due to the success of i-80 Gold and Paycore Minerals, announcements of pending drill results and more drilling.
In closing
In this report, I wanted to present some power charts and those that look to get more powerful. I have more stocks that I follow closely in my reports that have similar charts. Tomorrow I will have more to write about, stay tuned.
The four companies in this report are all sponsors of my reports. I have interviewed all of them and discussed them on my special reports. To start your homework on them I invite you to check out my Youtube channel to find the interviews and special reports.
As always my reports are for research only, before making any investment decisions you should speak with your financial advisors and do your homework. A good place to start your homework on the companies I follow is on my Youtube Channel. Then check out the websites of the companies I report on where you should look at their news releases and corporate presentations.
I hope you are enjoying the holidays and I would also like to wish you a prosperous 2023.
All the best,
Allan Barry Laboucan
Founder
Rocks And Stocks News